JLP:Jubilee Metals fell 12% of my original purchase price which isn't
really a big drop.
HUM:Hummingbird Resources dropped 11% and this purchase is proving to
be a massive mistake as it costs more for them to produce gold than they can
sell it for, even at these gold prices.
OPTI:Optibiotix fell a crushing 4p which is 7% and cost me £6,800 of
this week's fall. Goes to show how bad it is if my other shares lost £2,000.
APAX:Apax Global Alpha, SAE:Simec Atlantis Energy and
SBTX:SkinBioTherapeutics all dropped 5% for no particular reason.
The only shares to increase were CEY:Centamin, PLUS:Plus 500 and
iShares Physical Gold by 1%, which isn't worthy of a Share of the Week
award.

Back on the dreaded injection line

Big dip below the trend line
Here's the ISA and shares portfolio after week 39 of year 7.
| Weekly Change | |||
| Cash | £18.30 |
+£0 | |
| Portfolio cost | £82,598.82 | +£0 | |
| Portfolio sell value (bid price-commission) | £43,700.06 | (-47.1%) | -£4,026.31 |
| Potential profits | £2,115.29 | -£100.00 | |
| Yr 7 Dividends | £10,425.77 | +£0 | |
| Yr 7 Profit from sales | £3,664.29 | +£0 | |
| Yr 7 projected avg monthly profit | £1,562.23 | (42.4%) | -£41.11 |
| Total Dividends | £11,768.92 | +£0 | |
| Total Profit from sales | £27,788.23 | +£0 | |
| Average monthly cash profit |
£484.51 |
(13.1%) | -£1.39 |
|
(Sold stocks profit + Dividends - Fees / Months) |
|||
| Compound performance | 89% | +0% |
Potential profits only fell by £100 which is the best news. Huge £4,026 drop in portfolio value a bit more devastating though.

Bang on the injection line

Way below the trend line
The SIPP looks like this after week 335 overall and week 23 of year 7.
| Weekly Change | ||||
| Cash | £205.15 | +£7.36 | ||
| Portfolio cost | £95,148.22 | +£0 | ||
|
Portfolio sell value (bid price - commission) |
£53,310.54 | (-44.0%) | -£4,376.71 | |
| Potential profits | £223.71 | -£0.06 | ||
| Yr 7 Dividends | £10,565.04 | +£7.36 | ||
| Yr 7 Interest | £0 | +£0 | ||
| Yr 7 Profit from sales | £297.22 | +£0 | ||
| Yr 7 projected avg monthly profit | £2,030.84 | (45.9%) | -£90.86 | |
| Total Dividends | £13,769.43 | +£7.36 | ||
| Total Interest | £0.20 | +£0 | ||
| Total Profit from sales | £24,021.85 | +£0 | ||
| Average monthly cash profit | £477.13 | (10.8%) | -£1.34 | |
|
(Sold stocks profit + Dividends - Fees / Months) |
||||
| Compound performance | 69% | -1% |
Similar drop in portfolio value to the ISA but practically no change in the potential profits. I received a £7 dividend from SMS:Smart Metering Systems who pay quarterly.

Fractionally above the injection line - huzzah!

As with the ISA, well below the trend line
The trading account looks like this after week 301 overall and week 41 of year 6.
| Weekly Change | |||
| Cash | £259.74 | +£0 | |
| Portfolio cost | £2,374.14 | +£0 | |
| Portfolio sell value (bid price - commission) | £789.58 | (-66.7%) | -£89.27 |
| Potential profits | £0.00 | +£0 | |
| Year 6 Dividends | £0.00 | +£0 | |
| Year 6 Profit | £0.00 | +£0 | |
| Yr 6 projected avg monthly profit | £0.00 | (0%) | +£0 |
| Dividends | £60.10 | +£0 | |
| Profit from sales | £937.88 | +£0 | |
| Average monthly cash profit | £14.37 | (7.3%) | -£0.05 |
|
(Sold stocks profit + Dividends - Fees / Months) |
Huge devastating drop of £89. What a total disaster.

Not a record low - is that something to celebrate?
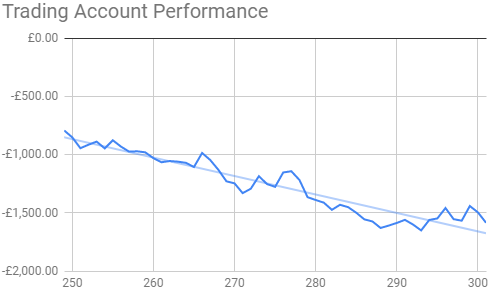
Still above the trend line - what a result!
Nothing more to say as too depressed.
No comments:
Post a Comment