Friday, 28 October 2016

Week 64 Review and More Optibiotix

First things first. I couldn't stand it any longer. It was utter torture watching OPTI:Optibiotix continue to drop in price. I was already over my 10% maximum limit, but as every day passes I become more convinced that this company is going to achieve success so spectacular that people are going to be astounded it stayed so low for so long.

I've been waiting for months to sell NTBR:Northern Bear, which although I'm sure is a great company, is doing nothing and going nowhere and incredibly illiquid thanks to the tiny number of shares in circulation. Last time I attempted to sell I couldn't get a price. This time I did, and sold for a £57.54 loss, but liberated £1,344 to buy more OPTI:Optibiotix at these crazy bargain prices.

I bought 2,044 shares at 65.89p costing £1,355.74. Given my ISA holdings cost 86.49p each and my SIPP holdings 77.1p these are so, so cheap. Unfortunately, with the bid price now 65p my total holding is losing £1,389.68 retaining it's nemesis share status. However, I am absolutely confident this will be £1 a share before too long, at which point it will be up by £1,744. It just needs a few partnership announcements and then the floating of Skinbiotix. It does mean that Optibiotix now constitutes 12.6% of my combined portfolios.

Meanwhile, worst performer this week was AMYT:Amryt Pharma dropping 15%, my second biggest holding at 8.9% of my portfolio. Somewhat devastating given each 1p loses me £272. CRL:Creightons dropped 12% but I think this is profit taking after a long run upwards. TLOU:Tlou Energy also had a bad week after a recent good run, falling 10%. You could almost believe that any AIM share that goes on a run is doomed to plummet shortly afterwards.

At the good end of the performance spectrum, RED:RedT Energy reversed it's recent post-climb drop to increase 12% and is one of my best performaing shares. Share of the Week was IOG:Independent Oil & Gas which has recovered from discovering tar, bought the Vulcan gas fields and the share price promptly climbed 33% taking this back into a 17% profit.

Here's the ISA and share account performance after week 64


Weekly Change
Portfolio cost£41,334.88
-£46.15
Portfolio sell value (bid price - commission)£36,921.62(-10.7%)-£854.09
Potential profits£2,563.48
-£167.13
Yr 2 Dividends£140.67
+£8.31
Yr 2 Profit from sales£2,338.74
-£57.54
Yr 2 Average monthly cash profit£892.53
-£100.55
Yr 2 Avg annual % of current portfolio cost25.9%
Total Dividends£808.60
8.31
Total Profit from sales£6,179.00
57.54
Average monthly cash profit£468.53
-£10.82
(Sold stocks profit + Dividends - Fees / Months)
Avg annual % of current portfolio cost13.6%

The portfolio cost dropped slightly due to the loss when selling NTBR:Northern Bear. Sell value plummeted in a most disasterous fashion, but potential profits only down by £167 so most of this is deepening loss, and mainly OPTI:Optibiotix, AFG:Aquatic Food and AMYT:Amryt Pharma. One day they will turn around!

There was a small dividend from CMCL:Caledonia Mining which pays out a quarterly dividend. Unfortunately that wasn't enough to make up for the damage of the sale loss in reducing average monthly profit by £10.82 a month.


I'm getting really fed up with this graph. This is now the most consistently bad performance since I started, and all the more frustrating given the great performance just before it started going wrong. I think the reason is the high percentage of volatile high-risk shares in my portfolio. It does mean that if I've called it right, something very interecting could happen in the next few months.

The SIPP looks like this after week 48


Weekly Change
Portfolio cost£15,593.67
0
Portfolio sell value (bid price - commission)£17,625.12(+13%)+£174.62
Potential profits£2,689.64
+£194.15
Dividends£413.19
122.40
Profit from sales£2,349.86
+£0
Average monthly cash profit£245.49
+£6.07
(Sold stocks profit + Dividends - Fees / Months)
Avg annual % of current portfolio cost18.9%

The pension fund has a much lower risk profile than the other portfolios, and it certainly shows. Yet another steady rise taking the paper value 13% higher than cost. Not only that, the £122.40 dividend was a very nice surprise. If I'd realised it was coming, I would have held fire for a week to get BMN:Bushveld Minerals. £5.03 came from JLG:John Laing Group and £117.37 came from CAML:Central Asia Metals. Did I mention this is the best run company in my portfolio? I will be getting more of these if the price dips again, as in just over 12 months I've had £260.33 dividends and they're up by £537.29 above purchase price, although they do make up 6% of my portfolio. The dividend is enough to push up the projected average monthly profit by £6 a month despite there being no sales this month.
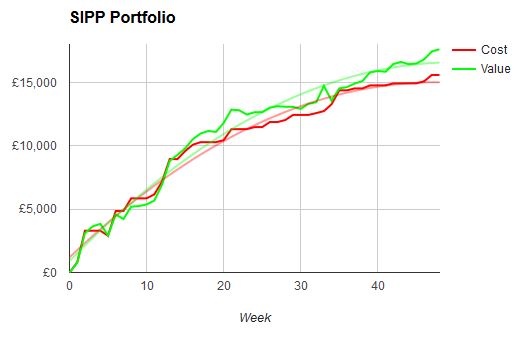

And so the graph continues to improve week after week.

Here's the trading account after week 14


Weekly Change
Portfolio cost£499.95
+£0
Cash£0.05
0
Portfolio sell value (bid price - commission)£471.63(-5.7%)+£26.86
Potential profits£0
+£0
Dividends£0
0
Profit from sales£0
+£0
Average monthly cash profit£0
+£0
(Sold stocks profit + Dividends - Fees / Months)
Avg annual % of current portfolio cost0%

Could it really be? Could SLP:Sylvania Platinum really be heading towards profit? Will next week allow me to sell them and do something exciting with a short term basket case stock? Actually no, as I'll be off on holiday for a few weeks after next weekend so reckon I'll leave this and give it a chance to grow so I can have more fun with it just before Christmas.


Ooooh - it's so close to crossing the line - the long wait may almost be over!

That's it for Week 64. All eyes are now on OPTI:Optibiotix. I've committed myself massively to the success of this company because I believe in the story, the approach, the fact that lots of deals have been done but wrapped in non disclosure agreements, and that there will soon be a load of free shares in Skinbiotix which could become a multi-billion dollar company. Call me nieve, but when I'm so utterly convinced I have to go with it, and woe betide if I get this one wrong!

Saturday, 22 October 2016

Week 63 Review and New SIPP Share

This week was dominated by Vanadium - in fact Vanadium redox flow batteries. I've been following RED:RedT Energy very closely as their batteries could be a global game changer for making renewable energy work, and they are making me £920 potential profit so far. They are not alone in supplying these batteries, but they are ahead of the competition, have units in place, and a manufacturing deal with a major global producer. As if to confirm my excitement about their prospects, the share price reached a record high this week and increased 26%, making it my only double-digit riser and Share of the Week.

When I ended up with dividends and tax rebates in my SIPP, I topped them up to £500 from my current account and put my regular monthly saving on hold this month to prevent overspend. I needed to decide what to do with them, and I'd been looking into the supply of Vanadium that will be required if these types of batteries do take off. That's when I found BMN:Bushveld Minerals. They are establishing themselves as Vanadium specialist producers, have been buying assets and are planning to manufacture the Vanadium electrolyte used in redox flow batteries. I figured if this technology takes off, Bushveld will be in prime position to take advantage of it.

So my decision - do I invest the £500 in my SIPP on more RedT which is already 3.7% of my portfolio and at what could be a high spike in price, or do I get Bushveld which is near the bottom of a long term decline, but which has climbed about 15% over the last few days. I decided to go with Bushveld, so purchased 28,534 shares at 1.73p costing £502.59. An hour after I bought the shares, Bushveld issued an RNS announcing a placing, causing an instant drop in share price of 11%. With spread and commission, that means within an hour of my purchase, the share was down by 23% and is my worst performing share of the week. RNS nearly always come out at 7am, but this was at 12:30pm - it's so frustrating that if I'd waited just an hour I would have been able to buy an extra 4,000 shares for the same money. Never mind, I'm in it for the long term so if I'm right about Vanadium I should stand to make a decent profit from the 28,534 shares I did purchase.

Here's the ISA and share portfolios after week 63


Weekly Change
Portfolio cost£41,381.03
+£0
Portfolio sell value (bid price - commission)£37,821.86(-8.6%)+£304.70
Potential profits£2,730.61
+£208.03
Yr 2 Dividends£132.36
0
Yr 2 Profit from sales£2,396.28
0
Yr 2 Average monthly cash profit£993.18
-£99.32
Yr 2 Avg annual % of current portfolio cost28.8%
Total Dividends£800.29
0
Total Profit from sales£6,236.54
0
Average monthly cash profit£479.35
-£7.73
(Sold stocks profit + Dividends - Fees / Months)
Avg annual % of current portfolio cost13.9%

Nice to see the recent declines reverse, albeit just a little. Increased profits made up 2/3 of the increase so a few losses improved. No dividends or sales so the average monthly performance drops the usual small anount. Not too long before year 2 average drops down to overall average. It wouldn't surprise me if it drops below, as my priority is trying to get the paper performance in the black, which selling in-profit shares isn't going to help. I may re-think that approach if the average return rate starts dropping towards 10%.


At last, the green line takes a turn back upwards. Quite a bit of catching up to do though.

The SIPP looks like this after week 47


Weekly Change
Portfolio cost£15,593.67
502.59
Portfolio sell value (bid price - commission)£17,450.50(+11.9%)+£123.86
Potential profits£2,495.49
+£133.27
Dividends£290.79
0
Profit from sales£2,349.86
+£0
Average monthly cash profit£239.42
-£5.21
(Sold stocks profit + Dividends - Fees / Months)
Avg annual % of current portfolio cost18.4%

The extra cost was all from BMN:Bushveld Minerals, and given that made an instant £100 loss, the £123 increase in value is heartening and potential profits up by £133. No sales or dividends so the usual drop in monthly performance. We're only 5 weeks from the end of year 1, at which point the monthly performance will become real rather than projected.


I love this graph so much. Here's hoping it continues just like this.

Now then - the dreaded trading account after week 13


Weekly Change
Portfolio cost£499.95
+£0
Cash£0.05
0
Portfolio sell value (bid price - commission)£444.67(-11.1%)+£40.29
Potential profits£0
+£0
Dividends£0
0
Profit from sales£0
+£0
Average monthly cash profit£0
+£0
(Sold stocks profit + Dividends - Fees / Months)
Avg annual % of current portfolio cost0%

At least SLP:Sylvania Platinum has started going back up again. You get the distinct impression the marjet makers are dicking about with this share. It's been bouncing between 7p and 8.5p for months. Almost taunting me that I bought it at 9.14p thinking it was about to take off towards 15p, at which point I was going to sell and go in search of something else to play with for a few weeks. Oh no, here it sits, resolutely determined to spoil my fun!

Even the graph is just taunting me

Not sure what to expect next week. The ideal scenario would be OPTI:Optibiotix finally snapping out of it's stalemate at around 70p so I can shake off the £1,200 loss, for KIBO:Kibo Mining so reveal what's going on with the gold mine share issue so the price can get back to the 9p mark, for TLOU:Tlou Energy to recover from the inexplicable decline that's set in and halved the profits, for SLP:Sylvania Platinum to give some good results that allow me to ditch the shares in the trading account, and for IOG:Independent Oil & Gas to say "Oops - that sample wasn't tar after all" so I can salvage something from that disaster...

Thursday, 20 October 2016

Week 62 Review

Only one double digit loser this week, but unfortunately it's a very significant one. KIBO:Kibo Mining dropped 21% and was responsible for much of this week's losses.

CMCL:Caledonia Mining recovered from last week's drops to go just into profit by climbing 11%, but Share of the Week was WRES:W Resources which climbed 17% and the SIPP holding is now in profit.

Here's the effect on the main portfolios


Weekly Change
Portfolio cost£41,381.03
+£0
Portfolio sell value (bid price - commission)£37,517.16(-9.3%)929.74
Potential profits£2,522.58
-£973.12
Yr 2 Dividends£132.36
12.00
Yr 2 Profit from sales£2,396.28
0
Yr 2 Average monthly cash profit£1,092.50
-£121.38
Yr 2 Avg annual % of current portfolio cost31.7%
Total Dividends£800.29
12.00
Total Profit from sales£6,236.54
0
Average monthly cash profit£487.08
-£7.99
(Sold stocks profit + Dividends - Fees / Months)
Avg annual % of current portfolio cost14.1%

Amazingly the drop in profits accounted for more than the overall drop in value. This was nearly all down to KIBO:Kibo Mining plummeting in value when I'm so heavily invested and was making such great profits.TLOU:Tlou Energy was down 9% which was also costly.

The £12.00 dividend was actually part of the liquidation sale of PUR:Pure Wafer, which appeared by magic in my account after being transferred from my Brewin Dolphin holding account, as they were unable to transfer these share to Hargreaves Lansdown when the rest of my portfolio transferred. There should be another £33 to come from these before the final liquidation.

I could do with selling something in order to get average monthly profit back over £500, but my new philosophy is to hold forever, unless there's something wrong with the company.


Ouch! A disasterous graph. It was going so well, but now horribly wrong. That's as big a drop as Brexit, and mostly down to a handful of shares having zoomed up only to crash back down.


The SIPP looks like this after week 46


Weekly Change
Portfolio cost£15,091.08
159.02
Portfolio sell value (bid price - commission)£16,824.05(+11.5%)+£162.93
Potential profits£2,362.22
+£177.72
Dividends£290.79
0
Profit from sales£2,349.86
+£0
Average monthly cash profit£244.63
-£5.44
(Sold stocks profit + Dividends - Fees / Months)
Avg annual % of current portfolio cost19.5%

So much better than the share and ISA portfolios, but then the risk profile is a lot safer in this account. The monthly savings went through, adding £159.02 worth of LGEN:Legal & General. I've temporarily cancelled the monthly savings next month, as I have £160 from dividends and tax returns to spend. The only way to get rid of it is to top up to £500 instead of doing my monthly saving. Hopefully I'll make the purchase tomorrow - and it will be a surprise share!


Very nice graph indeed.


I suppose I need to go through the trauna of showing the trading account performance after week 12


Weekly Change
Portfolio cost£499.95
+£0
Cash£0.05
0
Portfolio sell value (bid price - commission)£404.38(-19.1%)-£53.72
Potential profits£0
+£0
Dividends£0
0
Profit from sales£0
+£0
Average monthly cash profit£0
+£0
(Sold stocks profit + Dividends - Fees / Months)
Avg annual % of current portfolio cost0%

Will I ever sell this tedious share?! This account was meant to be fun.


Bleh!

So a week of contrasts. Good for SIPP, bad for others. If KIBO:Kibo Mining can turn back to the 9p region then most of the losses will be reversed. OPTI:Optibiotix still frustrates as Nemesis Share with a £1,200 loss that could be reversed with a small swing upwards. AMYT:Amryt Pharma keeps dropping and the hefty gains are now back as hefty losses, and after a brief rally AFG:Aquatic Food is back in the doldrums and only £100 off Nemesis Share. LOOK:Lookers has collapsed again and is now at £900 loss.

Looking forward to buying a brand new share in my SIPP next week. It's a long shot but could be very interesting.


Sunday, 16 October 2016

Week 61 Review

This week's review is a week late - and the next one might be too is my back doesn't get better!

Worst performing share in week 61 was TLOU:Tlou Energy, dropping 29% for no apparent reason. The other double-digit loser was IOG:Independent Oil & Gas which continued to drop after discovering a tar pit rather than an oil well. Shares dropped another 11% and are now making an 11% loss from 100% profit a few weeks ago.

Not all gloom and doom, with KIBO:Kibo Mining climbing another 10% and consolidating at over 8p. That wasn't enough for Share of the Week though, as CRL:Creightons climbed another 24% to go 73% up overall and win for the 2nd week in a row. Not bad considering there has been no news whatsoever.

The main portfolios look like this after week 61


Weekly Change
Portfolio cost£41,381.03
+£0
Portfolio sell value (bid price - commission)£38,446.90(-7.1%)309.78
Potential profits£3,495.70
+£58.81
Yr 2 Dividends£120.36
3.18
Yr 2 Profit from sales£2,396.28
0
Yr 2 Average monthly cash profit£1,213.88
-£145.55
Yr 2 Avg annual % of current portfolio cost35.2%
Total Dividends£788.29
+£11.70
Total Profit from sales£6,236.54
0
Average monthly cash profit£495.07
-£7.42
(Sold stocks profit + Dividends - Fees / Months)
Avg annual % of current portfolio cost14.4%


Dowm £300 which is much better than last week, although still in the wronmg direction. Potential profits were up so it goes to show how bad the deepening losses were. Tiny dividend on £3.18 came from TW.:Taylor Wimpey


Despite the poor two weeks, the trend lines are at least moving in the right direction, but they'll start to diverge if things don't pick up soon.


The SIPP looks like this after week 45


Weekly Change
Portfolio cost£14,932.06
+£0
Portfolio sell value (bid price - commission)£16,502.10(+10.4%)+£57.26
Potential profits£2,184.50
+£20.53
Dividends£290.79
0
Profit from sales£2,349.86
+£0
Average monthly cash profit£250.07
-£6.29
(Sold stocks profit + Dividends - Fees / Months)
Avg annual % of current portfolio cost19.9%

A bit of a standstill week, but marginally up on both value and potential profits. Overall cash profit dips below 20% but that will be inevitable as I don't want to asell any more this year.


Tha gap is being maintained. I just need OPTI:Optibiotix to take off and get it wider!


The trading account looks like this after week 11


Weekly Change
Portfolio cost£499.95
+£0
Cash£0.05
0
Portfolio sell value (bid price - commission)£417.81(-16.4%)-£40.29
Potential profits£0
+£0
Dividends£0
0
Profit from sales£0
+£0
Average monthly cash profit£0
+£0
(Sold stocks profit + Dividends - Fees / Months)
Avg annual % of current portfolio cost0%

Yawn...


Yawn...

A pretty standstill week - now just need to catchup on week 62...

Friday, 30 September 2016

Week 60 Review - A Crappy Week

All the optimism, all the excitement that the share and ISA accounts might go into the black after the total combined portfolios made it into the black. Not only was that excitement dashed this week, but the combined portfolios have sunk into a deep black hole of misery as bad news after bad news came through relentlessly.

Biggest catastrophe of the whole week occurred today, when results from the Skipper oil sampling showed that rather than the expected free-flowing oil, the well is in fact full of tar. The share price had already dropped off on lack of news, but after a massive drop today, IOG:Independent Oil & Gas has fallen 76% this week, and my nearly 100% profits have been completely wiped out. I really thought this was a sound long term holding rather than a sell-quick share. I still believe it's good for the long term, but my confidence has taken a nasty hit. Fortunately this company isn't dependent on only this well, but I doubt the price will ever rocket again, as the board have seriously lost the trust of investors.

Next biggest disaster was AFG:Aquatic Food which dropped 14% over the week following lukewarm results, and with bulletin board posters and tabloid website posters declaring the whole company is a fraud. I don't believe it is, but my confidence has been rocked yet again. This share promptly fell into Nemesis Share territory, but is saved today as OPTI:Optibiotix drops yet again and regains the title.

The other double-digit loser this week was RED:RedT Energy. I suspect it's profit taking after last week's rises, as things are just getting interesting for this share.

Only one double-digit riser all week, so no competition for Share of the Week, with CRL:Creightons climbing 15% and taking to overall potential profit of 49%.

Here's a sad summary of the share and ISA portfolios


Weekly Change
Portfolio cost £41,381.03
+£174.43
Portfolio sell value (bid price - commission) £38,756.68 (-6.3%) -£1,257.67
Potential profits £3,436.89
-£570.56
Yr 2 Dividends £117.18
+£11.70
Yr 2 Profit from sales £2,396.54
+£92.37
Yr 2 Average monthly cash profit £1,359.43
-£129.78
Yr 2 Avg annual % of current portfolio cost 39.4%
Total Dividends £785.11
+£11.70
Total Profit from sales £6,236.54
+£92.37
Average monthly cash profit £502.49
-£0.87
(Sold stocks profit + Dividends - Fees / Months)
Avg annual % of current portfolio cost 14.6%


Portfolio cost rose a little when I re-invested my SLP:Sylvania Platinum profit and some dividends to buy more IQE:IQE, but the profit was only £92 as there was a small loss selling SGRO:Segro to buy CMCL:Caledonia Mining. The dividend was from Segro, so the combined dividends from that company took the overall performance from Segro to a tiny profit. Loss of potential profits was £570 so the other £700 deficit this month was deepening losses. The sale means average monthly profits just stay over £500, but that won't survive next week.

Ouch! So near to crossing the red line but then clobbered in one of the worst weeks since Brexit.

The SIPP looks like this after week 44


Weekly Change
Portfolio cost £14,932.06
+£0
Portfolio sell value (bid price - commission) £16,444.84 (+10.1%) -£181.65
Potential profits £2,163.97
-£152.89
Dividends £290.79
0
Profit from sales £2,349.86
+£0
Average monthly cash profit £256.36
-£5.96
(Sold stocks profit + Dividends - Fees / Months)
Avg annual % of current portfolio cost 20.6%

No additions, sales or dividends, just a bit of a drop mostly from reduced profits rather than deepening loss.

The gap narrowed slightly, but it's still a comfortable gap.

The trading account looks like this after 10 weeks


Weekly Change
Portfolio cost £499.95
+£0
Cash £0.05
0
Portfolio sell value (bid price - commission) £458.10 (-8.4%) +£13.43
Potential profits £0
+£0
Dividends £0
0
Profit from sales £0
+£0
Average monthly cash profit £0
+£0
(Sold stocks profit + Dividends - Fees / Months)
Avg annual % of current portfolio cost 0%

I guess I can't complain. This was the only account to go up this week, but 10 weeks is no fun!

Go green line go!

So ends a truly rubbish week. Biggest disappointment was IOG:Independent Oil & Gas analysis results, as these had been bigged up scandalously. AFG:Aquatic Food have gone back to being a basket case with accusations of fraud, but I'm staying loyal as I don't think the new Finance Director would have gone there if they were dodgy. AMYT:Amryt Pharma have gone back into loss after trickling downwards all week. OPTI:Optibiotix are dropping relentlessly and there's no sign of news to reverse it. JLP:Jubilee Platinum have drifted back downwards after a breakout looked inevitable and RED:RedT Energy have dropped practically back to break-even despite lots of exciting news.

So what is there to be positive about? I'm back invested in CMCL:Caledonia Mining which along with PAF:Pan African Resources gives me a couple of quality dividend paying gold mines again. CRL:Creightons had a great week as the only double digit riser. TLOU:Tlou Energy is still at over 100% profit and KIBO:Kibo Mining seems to have consolidated in the 8p range rather than the 5p range, and has moved back past Tlou to 2nd in the Star Share competition. It's still behind CWR:Ceres Power, which held onto it's share price despite announcing a massive placing. PUR:Pure Wafer have returned another 4p a share to investors as part of their liquidation, which is another £12 with more to come - assuming Brewin Dolphin let me know, as the shares are in a mystery holding account. Last but not least, I doubled my holding in IQE:IQE which I really, really wanted to do.

Let's see what happens next week...